


Up or Down Ser? 007 (Investor's Edition) - Lake of Fire
You swore that this time it would be different, that you'd buy the capitulation. Well, it's time to put you money where your mouth is.

Pain, misery & liquidations
Pain, despair and liquidations as far as my twitter feed will scroll. Bears calling for $10K Bitcoin, knife catching apes getting liquidated time and time again. The smart money is sidelined or buying dips in incrementally larger sizes, whilst much of the market has been trapped in spot from the 40s/50s, and have either pivoted to being long term investors, or decided to blow up their account by gambling potential bottoms on futures.
After all, how far off can the bottom be? Let’s take a look at some cyclical and high timeframe models to determine where we are in the cycle, how far the bottom might be, and how much more pain hodlers are expected to endure.
The below analysis is predicated on a long term investor’s timeframe and tolerance for drawdowns. Trading this on futures is guaranteed to get you liquidated.
Zoom out bro
The first chart we’re going to look at, and one of my favourites, is the 2-year MA multiplier.
The lower green line is the 2 year moving average
The upper red line is the 2 year moving average x 5
When price breaks above the upper band it’s considered overbought
When price breaks below the lower band it’s considered oversold
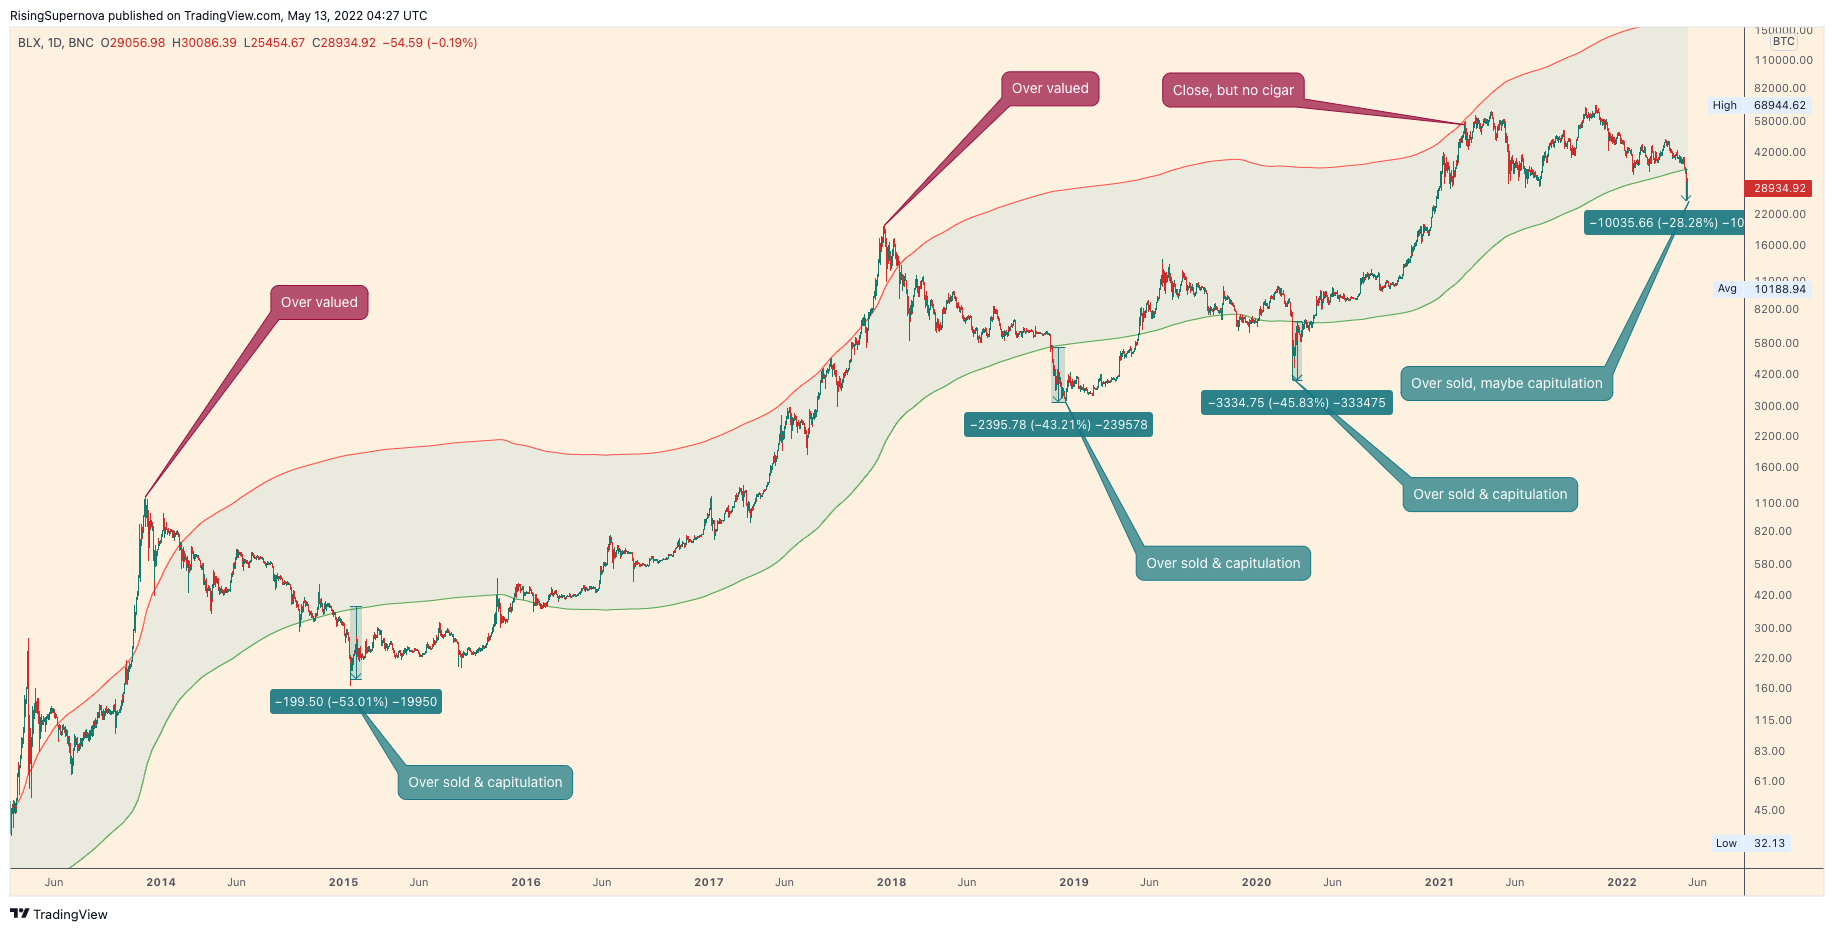
Can’t get simpler than that can it? As always however, there are a few considerations. The first being that price often extends past the bands by a significant distance. This means that this indicator describes accumulation or distribution zones rather than absolute bottoms or tops.
Another important factor to consider is that in each subsequent cycle, price breaches the bands by less, and for shorter periods of time (bar the Covid black swan). I personally got caught out at the last cycle top as we barely grazed the upper band.
Here’s a link to the chart image so you can take a closer look.
This tells us a couple of things:
DCAing into BTC at this level makes sense over the long term
Selling here is a negative EV proposition
Are we there yet?
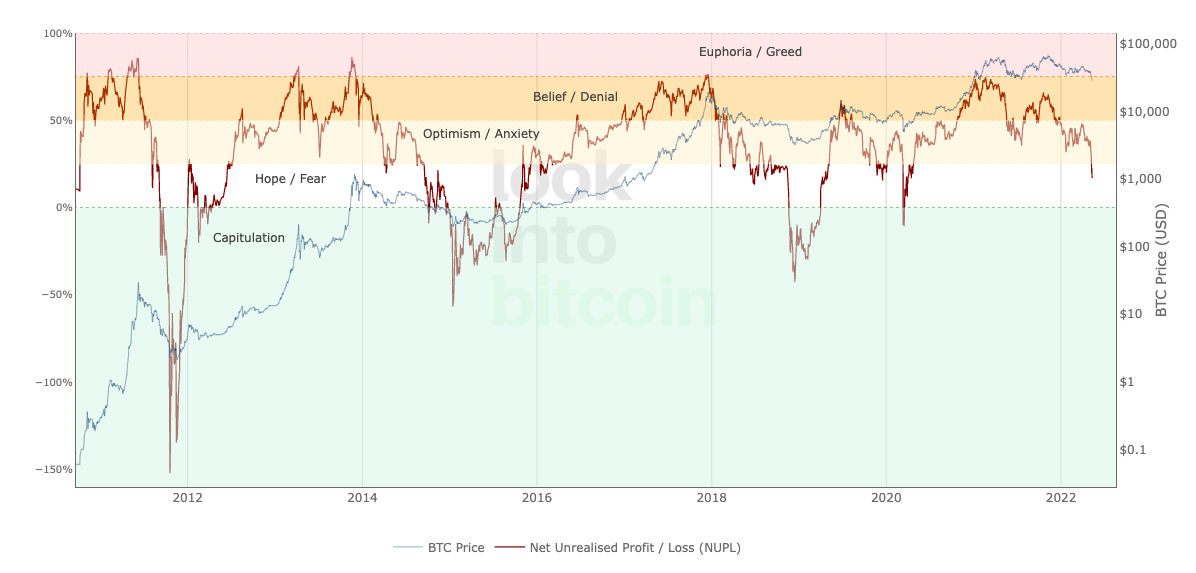
The above two charts are on-chain valuation models (if you’re unfamiliar with these, check out my on-chain fundamentals course).
The top chart is Net Unrealised Profit & Loss (NUPL), an indication of unrealised profits or losses across the market in aggregate. When the market is rallying much faster than participants are taking profits, there’s a large overhang, implying that the market is overbought (red band). This is generally where you want to take profit.
The green band on the other-hand, indicates that much of the market is at a loss and capitulating. This has often been the best place to begin to build a position.
As is the case with the two year MA multiplier, the peaks and troughs on the NUPL chart are getting lower and higher respectively. This suggests that the bottom is probably closer than most participants are anticipating.
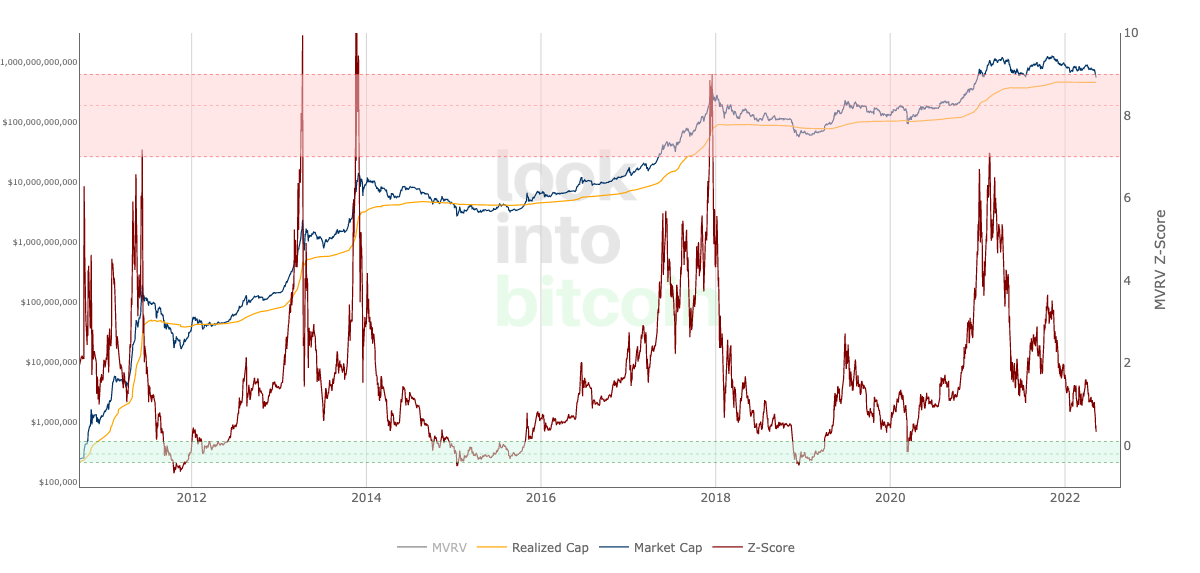
The lower chart is Market Value to Realised Value Z Score. If this sounds complicated, you simply need to know that it helps you identify when the market is either over or under valued. Price in red band = sell. Price in green band = buy.
As per the previous charts, we can see that the volatility in this indicator is diminishing, and that there’s a good chance that we bounce off the top of the oversold band.
But where bid ser?
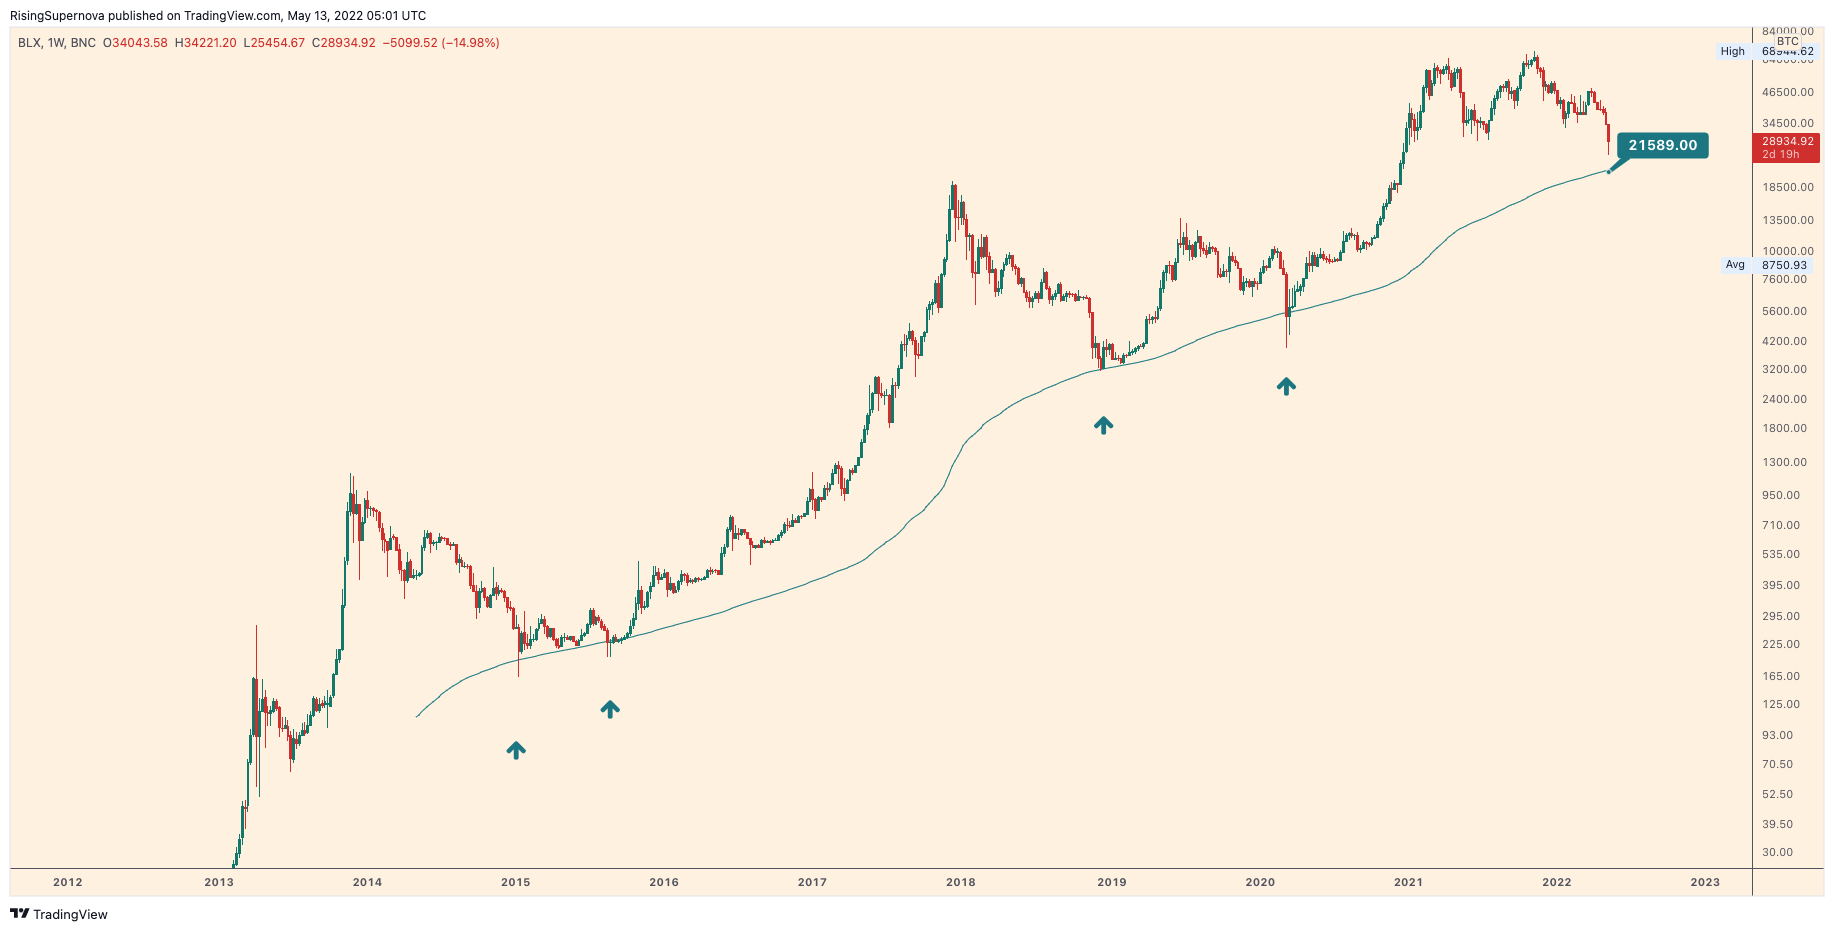
It’s common knowledge that the 200W MA has provided ultimate support in previous cycle lows. This is currently sitting at $21.5K, however it inches up every week (the 200W MA has never printed a down tick). Seeing that we’re on track to print seven red weeks in a row, and everyone is bidding this level, I expect it to be front run.
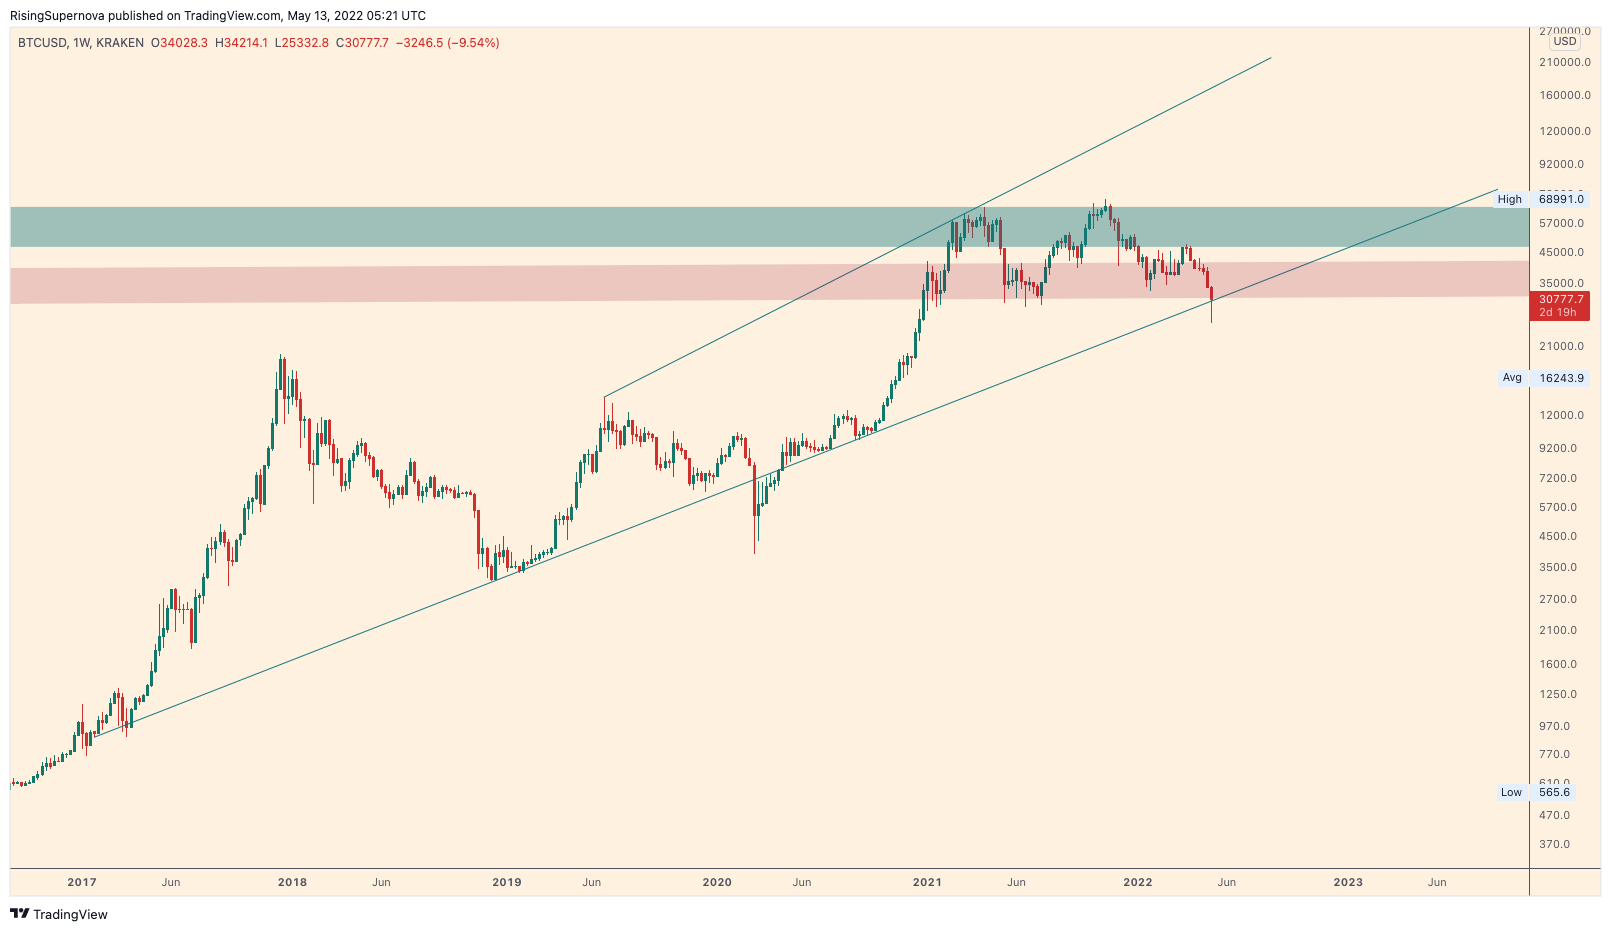
A decent play would be to buy a weekly close back within the range and above the HTF trendline, with invalidation being a close back below them. Should we fakeout to the upside and drop back down, then the chances of bottoming around the 200W MA increase dramatically. This is a crystal clear setup.
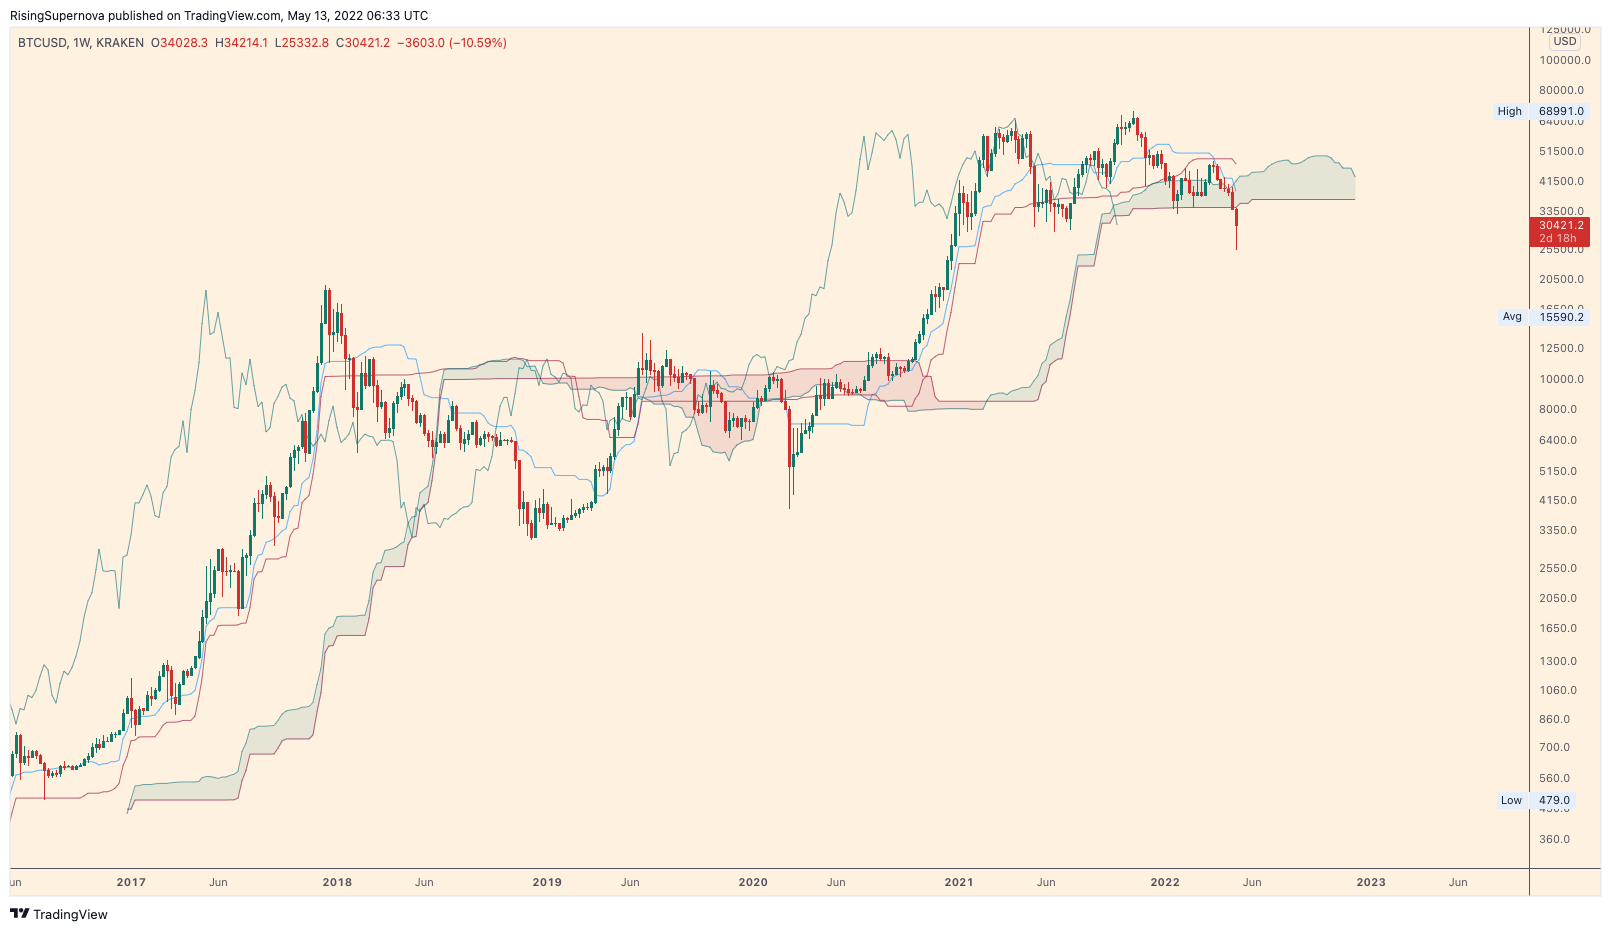
A safer play would be a close inside the weekly cloud, with invalidation being a close back below it. This offers a ~20% upside (playing an edge to edge trade), with clearly controlled downside risk.
The final setup would be to layer bids down to the 200W MA, or buy a confirmed bounce off it.
Trade safe, and have a great weekend!
TCP