


Up or Down Ser? 006 - Breakout?
Bulls have successfully reclaimed the 20MA & are on course to tackle key resistance over the weekend. Is third time the charm? We look at price action & On-Chain, as well as some price targets.

It’s been a while since I published a market report. Mostly due to the fact that we’ve been consolidating within a range for the past 60 days, and partially as I'm back in Europe, and enjoying family and friends trumps trading any day.
Nonetheless, it does seem that we’re approaching the moment of truth with a potential breakout and high timeframe market reversal. Whilst I’m leaning bullish, I’ll start off by covering the bearish scenarios, as it’s healthy to understand what losses one stands to endure, prior to planning on how much money they stand to make.
Where We Stand

High timeframe price action hasn’t changed one iota since the last update. We remain in the same godforsaken stacked ranges we’ve been ranging in for the past Four Hundred & Forty Seven Days. The up-shoot of this is that the entire $30-70K area is a minefield of failed patterns, false breakouts and liquidity hunts. The latest of which is a bearish pennant which has bears salivating at the prospect of a target in the mid-20’s.
Potential Bearish Outcomes
Outcome 1 - Nuclear Winter
The worst of the worst-case scenarios, uglier than a Swatch X Omega colab or a Gen 1 Fiat Multipla. In this scenario we get rejected from the pennant’s resistance line, break down to range lows at 29-30K, following which we nuke further to retest the 200W moving average in the low 20’s.
I consider the chances of this happening to be less than 5%, requiring a black-swan event, such as war spilling over into NATO countries, inflation blowing up past 10% requiring emergency hikes etc.
Should this happen, I’ll be bidding the 200W MA with every cent I’ve got.
Outcome 2 - Close but no Cigar
A more realistic scenario is one where we get rejected from the pennant’s resistance and either retest and bounce off its support, or simply range sideways past its apex for more directionless misery.
Counterintuitively this would be the max pain scenario, as it would require the patient trader to sit on their hands for several more weeks. I give this scenario a 20% probability.
Outcome 3 - Liquidity Grab & Dump
As it says on the tin, this scenario would see us break past the pennant’s resistance to trap late longs, huge sell volume into their bids as well as overrunning breakout traders with supply. We would then fall back into this range. I don’t think this outcome is very probable, as bears seem to be all but exhausted at this point (see on-chain section below).
With that out of the way, here’s why I’m bullish.
Weekly

On the weekly cloud, we see that we caught a strong bid each time we tested the lower cloud span B. Price has now closed above the cloud, and whilst the significance of this close is muted due to extended range we’ve been trading in, it does require us to view the market though slightly bullish lenses.
Headwinds abound, apart from the significant overhead supply at the TK lines, we see that the lagging span is below price. This is symptomatic of upcoming resistance including the W20MA, which many consider to be the line in the sand between bullish and bearish markets. Bears will always sell the 20MA, as that’s the closest point to their invalidation level, and mean reversion traders will tend to TP at it, so it must be considered a level of technical significance.
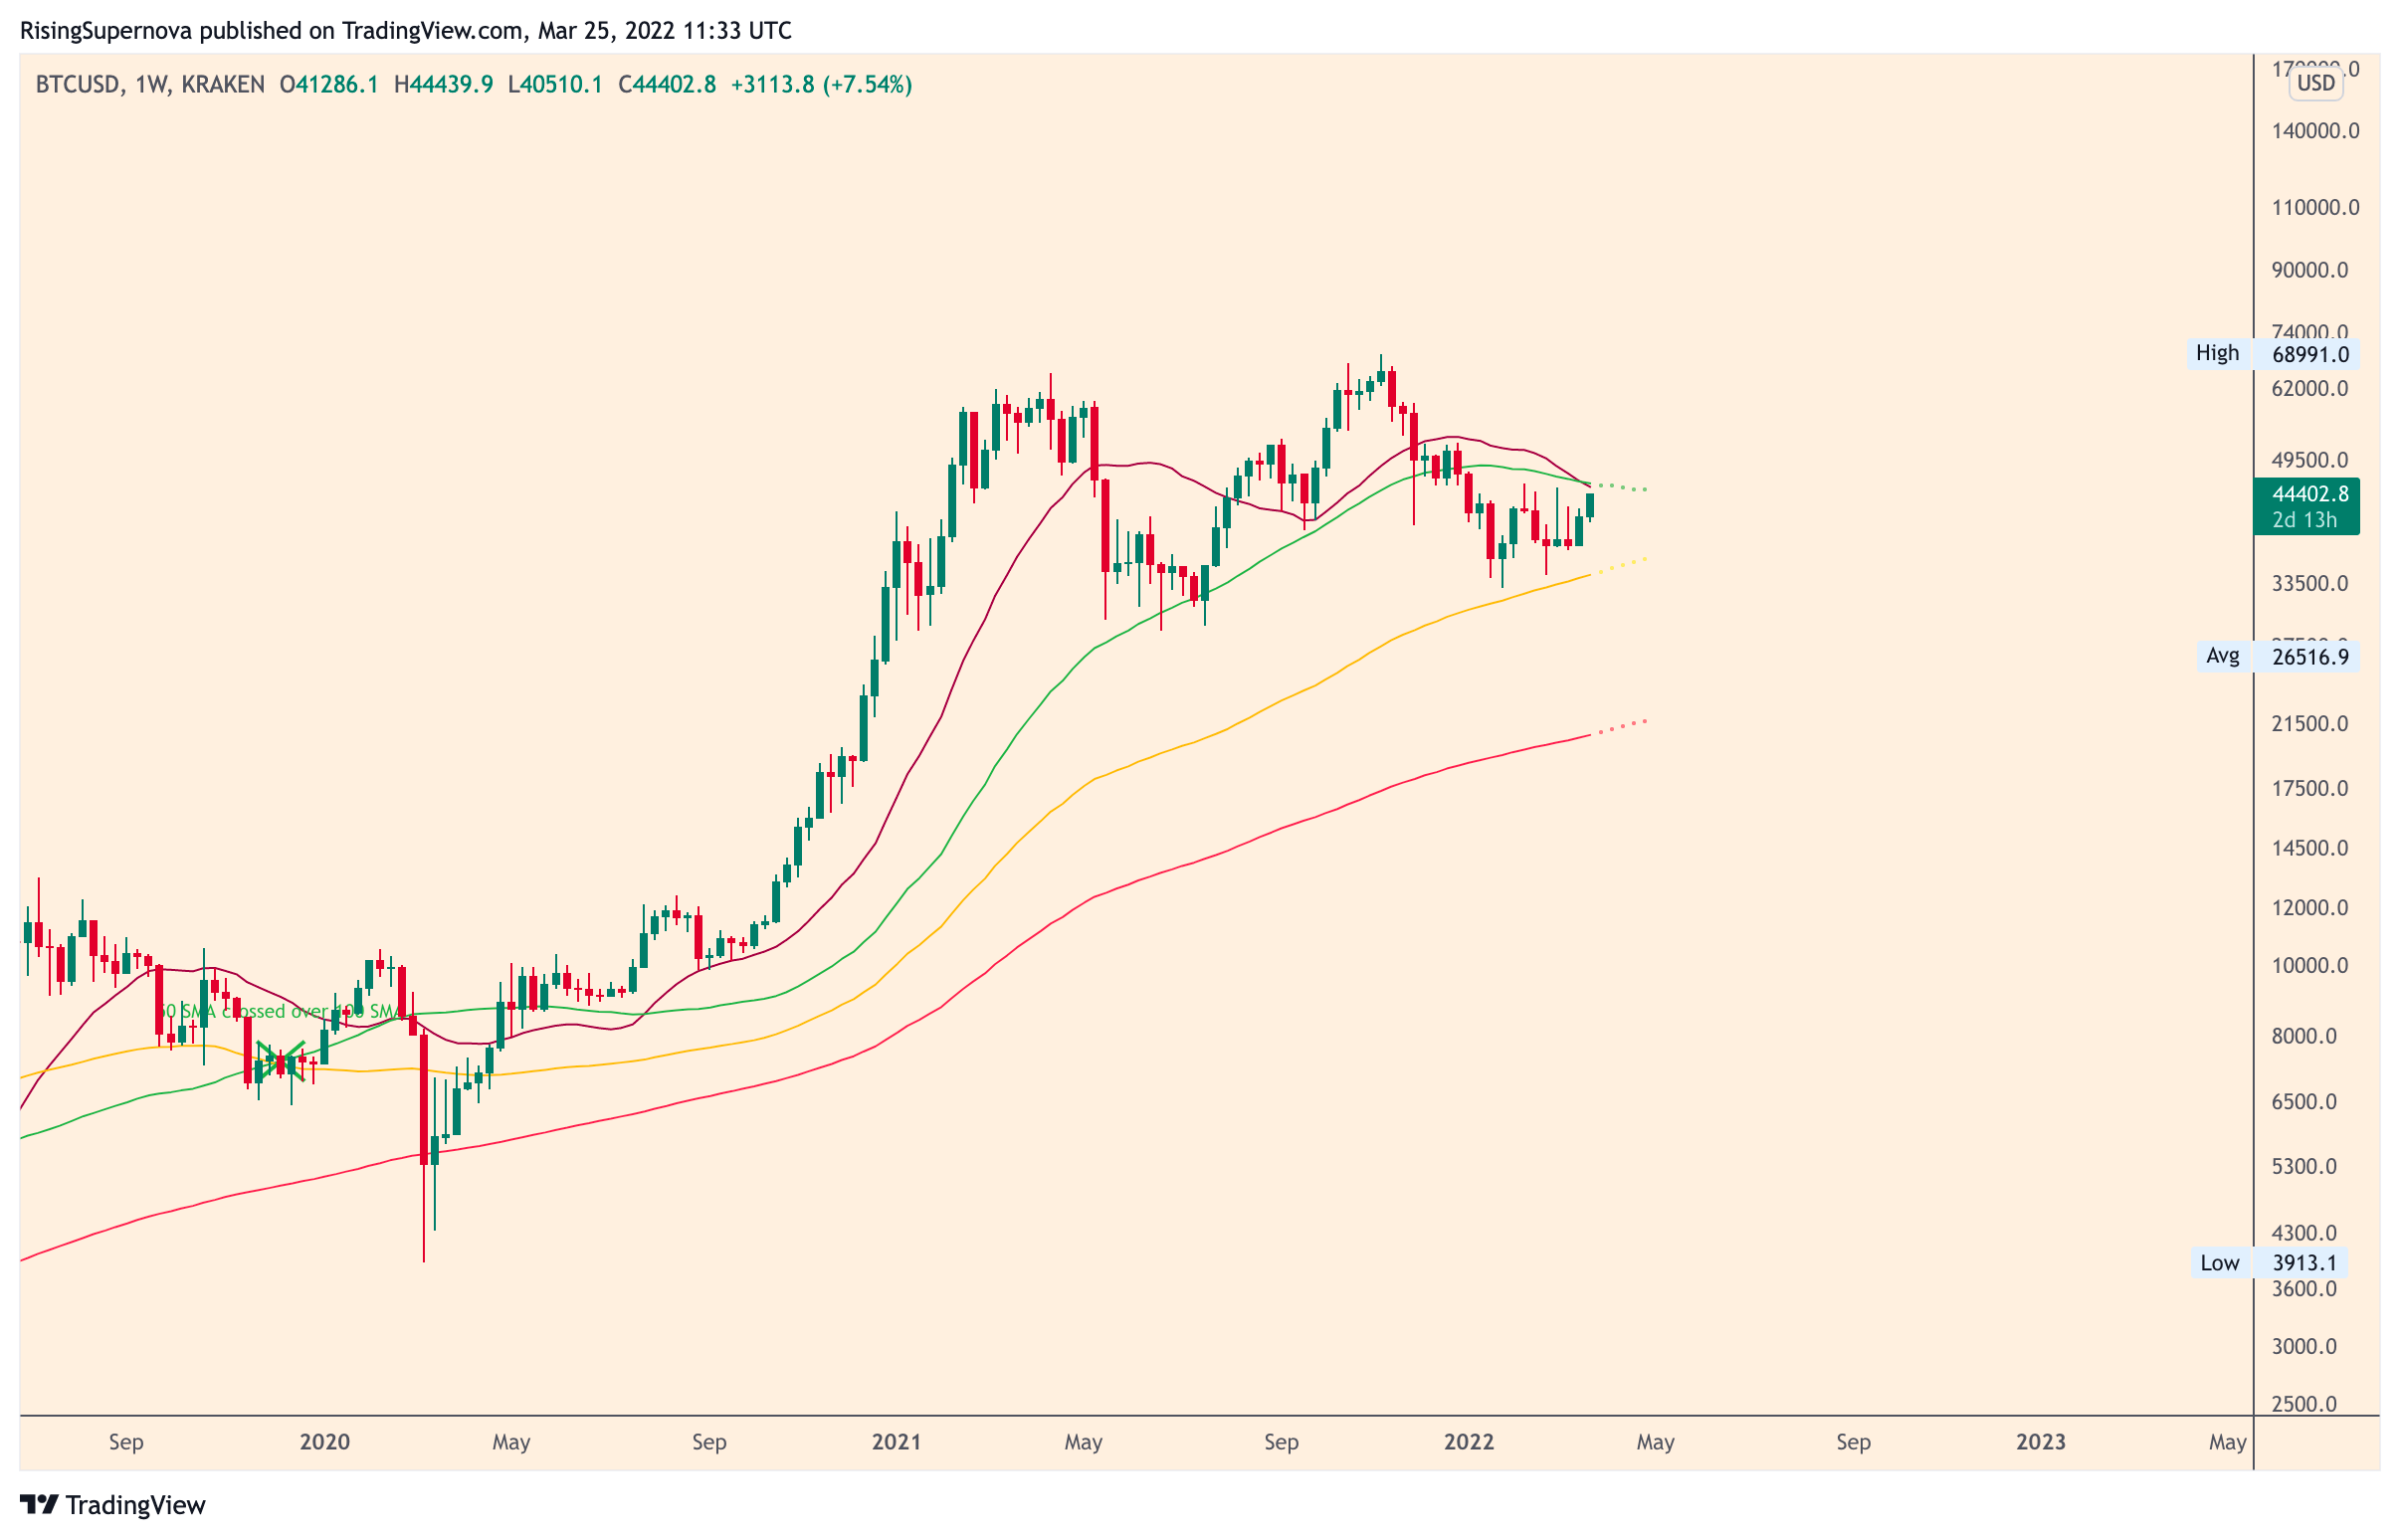

Assuming that we do reclaim the 20MA, it would be reasonable to expect BTC to trade up to 61K and remain within normal volatility. This does not imply that a reclaim equates to a straight line to 61K, rather that trading up to that level would not signify any dramatic shift in price action from a HTF point of view.
Daily

On the daily, we see that the cloud is beginning to show bulls some love, with lagging span above price, a bullish TK cross putting bears on notice, and a decisive close in the cloud, which unlike recent forays seems to be maturing into a proper edge to edge move. I expect cloud span B to provide significant resistance, and will be very surprised if we break through it on the first try.
Failed patterns tend to outperform successful ones, and if the market decides it really wants to cuck bears, well, the measured move for a pennant breakout is 61K.
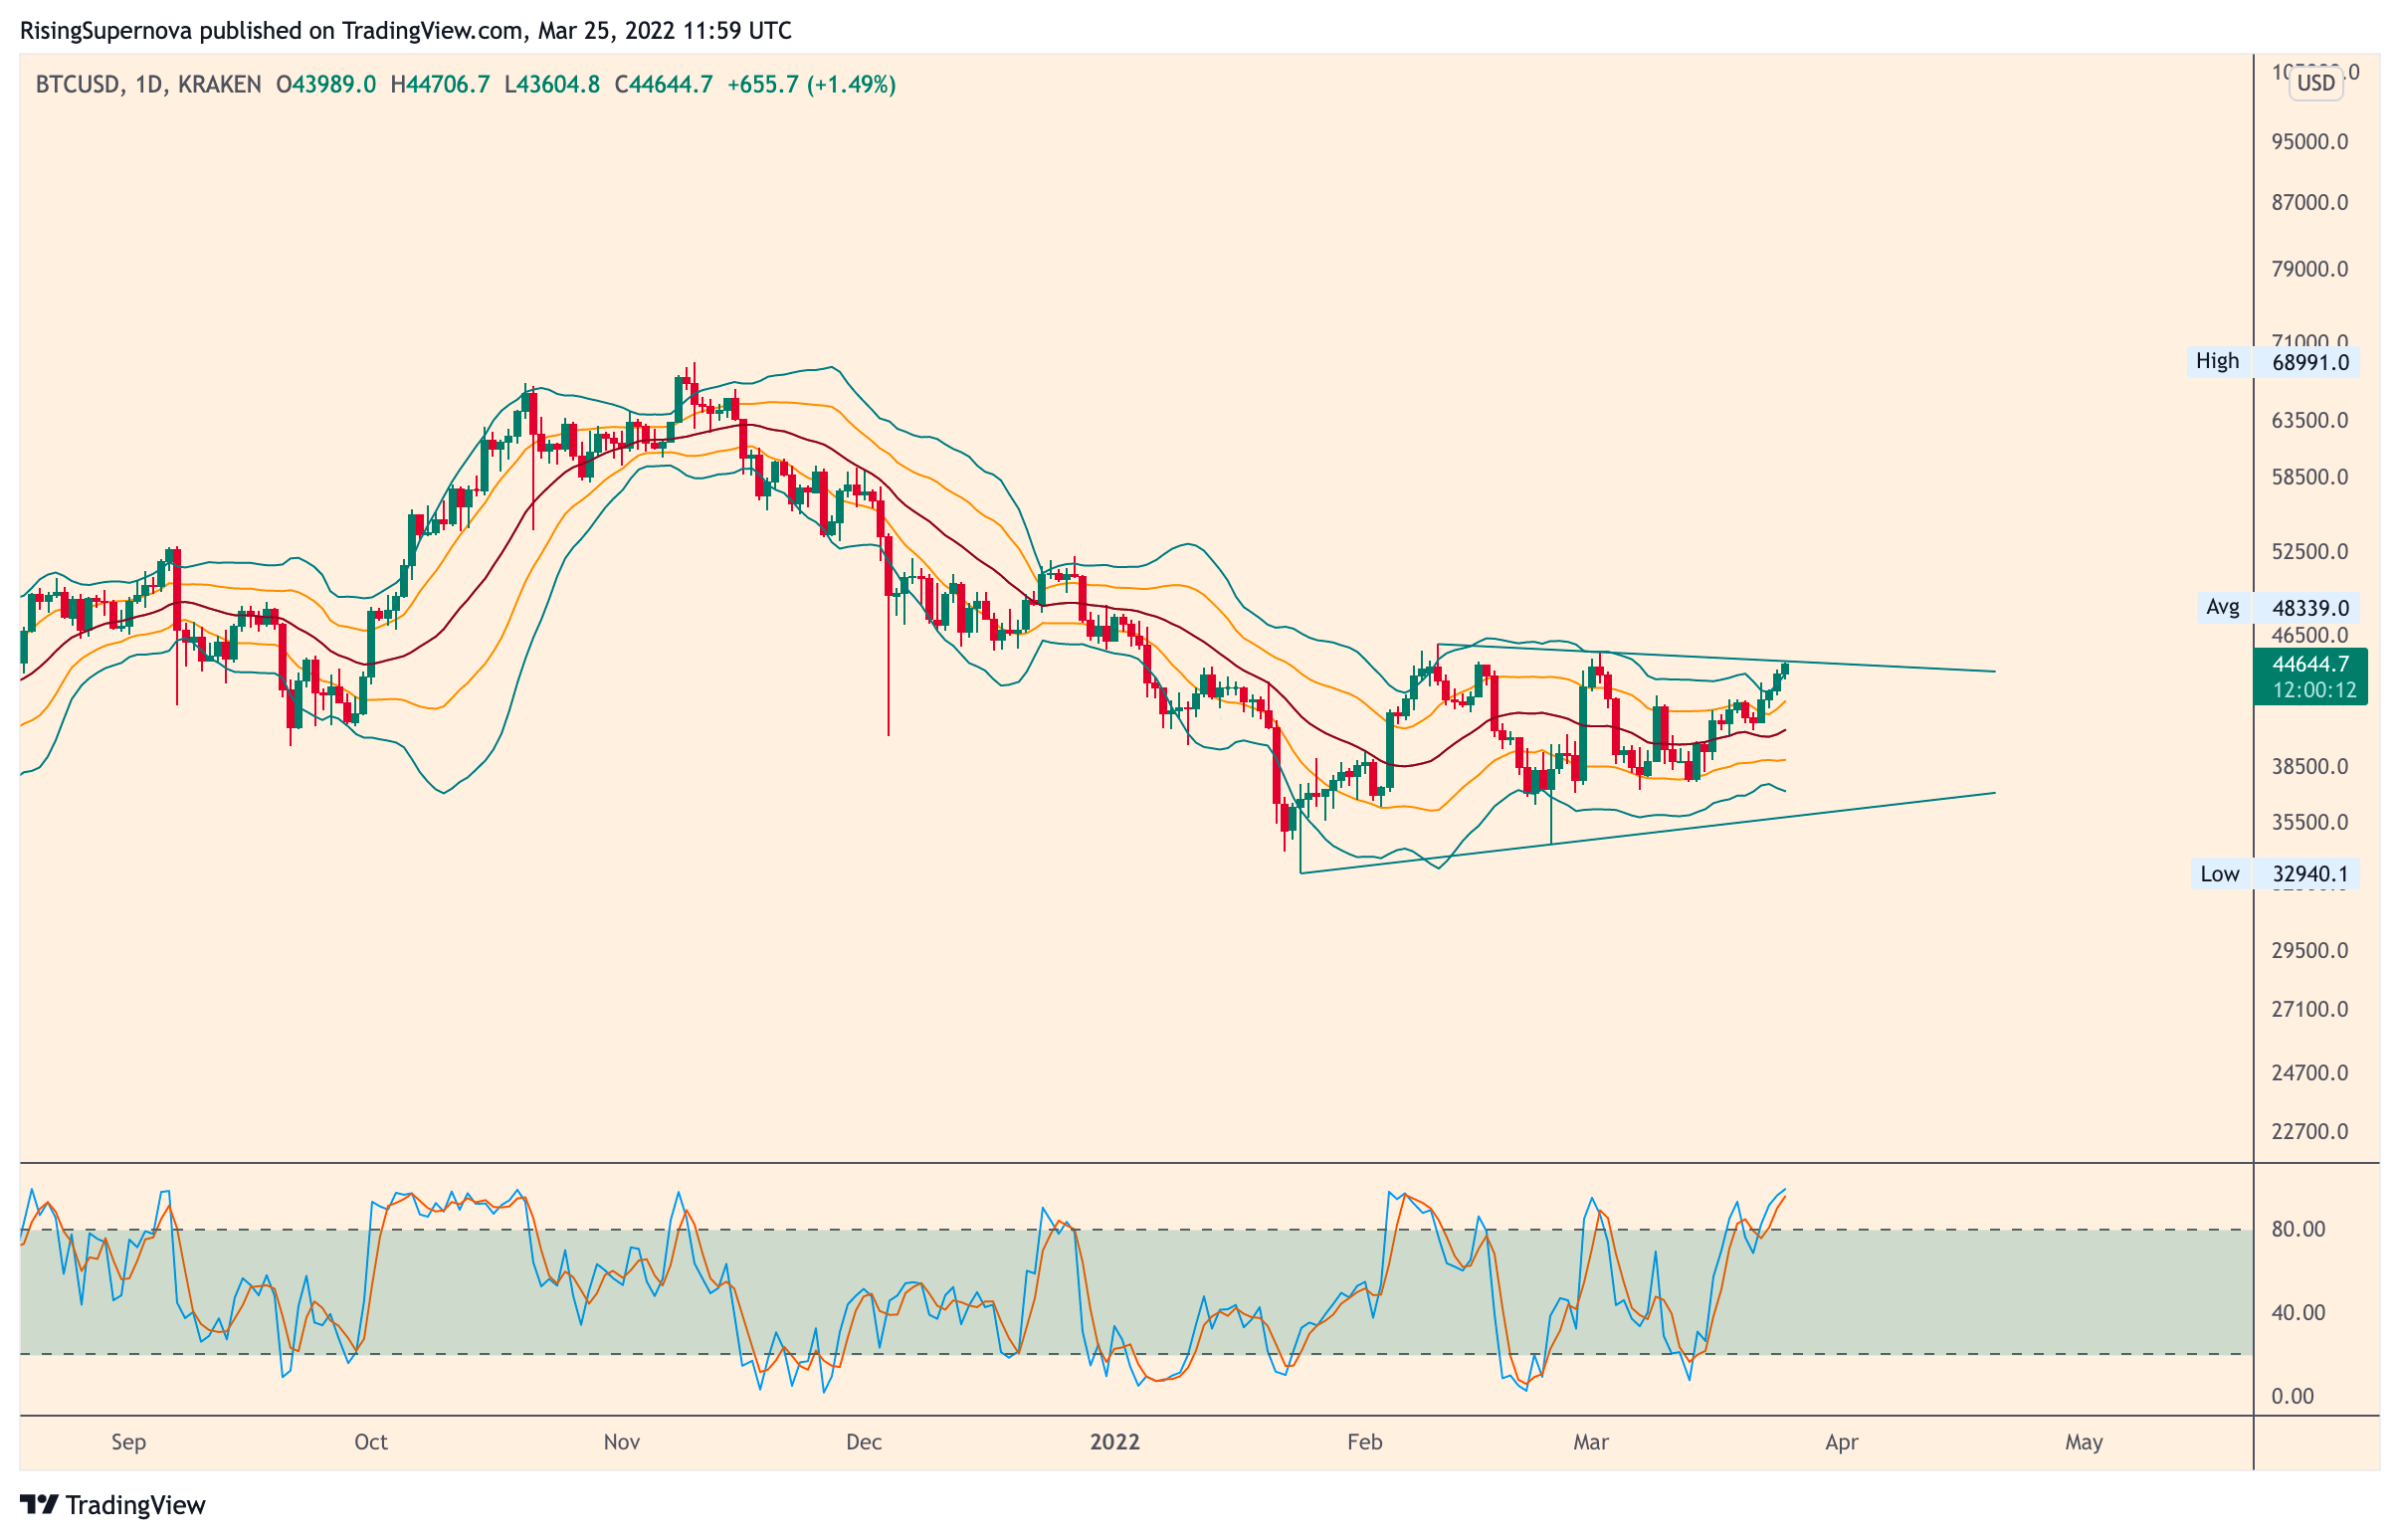
From a range trading point of view, we are beginning to close dailies though the upper Bollinger Band. This is a significant sign of strength, and whilst stoch is somewhat overbought, one must bear in mind that:
a) This is a range bound oscillator
b) It’s very fast moving and will only require a slight pullback to reset
12H

The 12H cloud is beginning to look fap-worthy as it’s in full bullish configuration:
✅ Bullish TK cross
✅ Price above cloud
✅ Bullish Kumo twist
✅ Lagging Span above price and cloud
✅ Cloud span B angling upwards. This generally implies incoming momentum
Not much comment needed here.

Volatility-wise we’re at a key inflection point. We’re at the top of the volatility envelope, with a couple of closes above the upper band signifying strength. At this point we either need to breakout and keep running, or retest the 20MA and then break through. Any outcome apart from those two would imply that resistance held and we’re due another swing down to (hopefully) form a higher low.
On-Chain
When price is chopping sideways, I always like to look at on-chain and fundamentals for direction. These are usually leading indicators, and can take weeks to materialise in price action. However over the long term, they’re very reliable.
Exchange Netflow

This is simply BTC deposited - BTC Withdrawn. Very crude and primitive, however we can clearly see that the overwhelming flow of BTC is outwards, reducing supply available for purchase.
Exchange Reserve

The above outflows have resulted in exchange reserves (supply sitting on exchanges ready for sale) to hit all time lows. As one can see from July to October 2020, a reduction in exchange volume tends to precede price rallies.
Funding Rate

What’s the point of bullish price action if the degens on Bybit cause a liquidation cascade? Well, so far it seems that they’ve ether learnt to temper their enthusiasm, or their mum has taken her credit card back, as funding has been hovering around neutral/negative for a while now. This indicates that the rally is spot driven and has legs.
Spent Output Profit Ratio (SOPR)
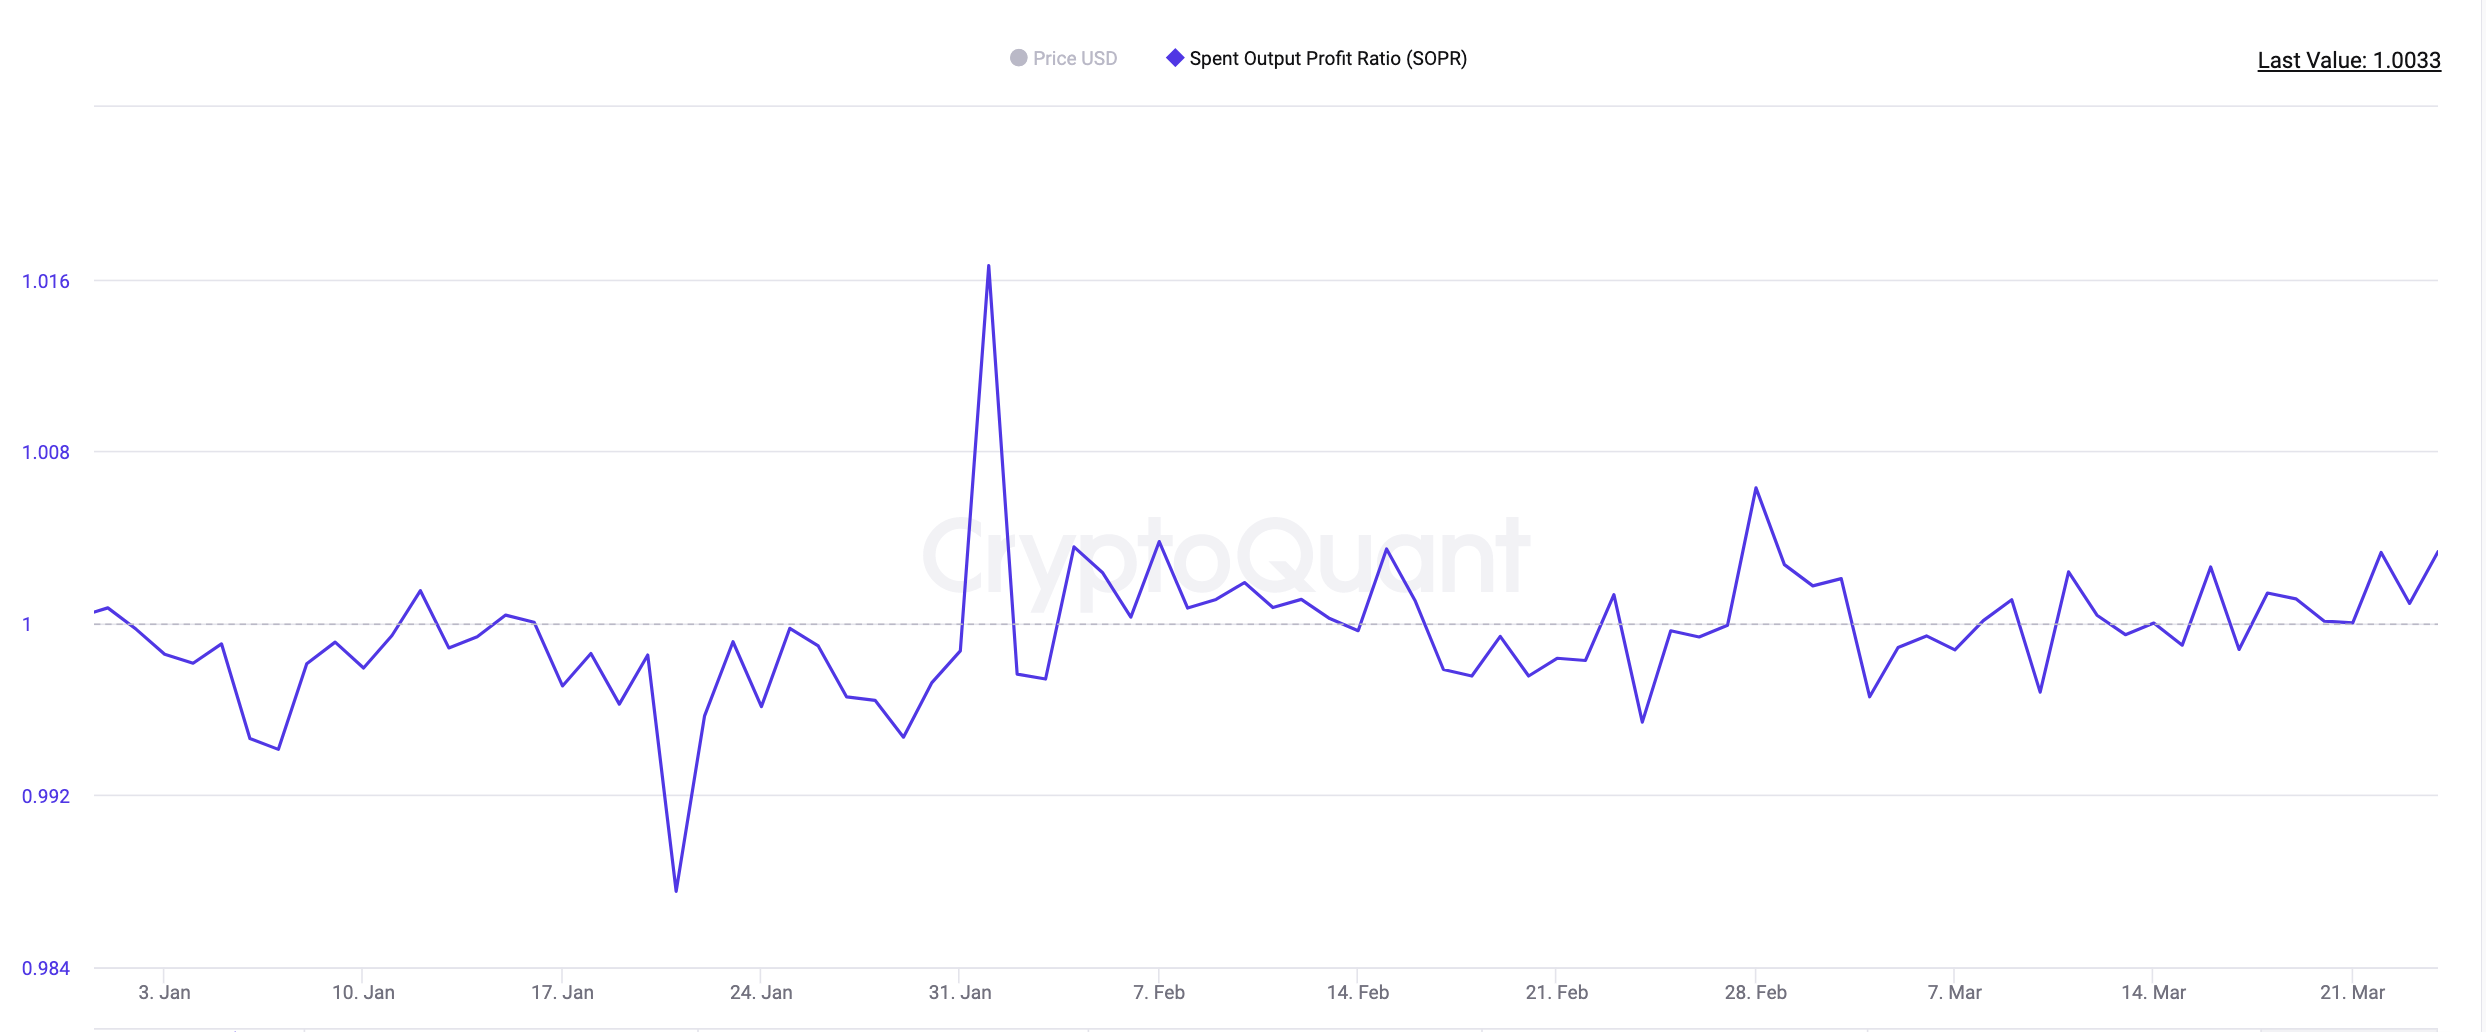
In simple terms, consider this to be the ratio of current price vs the price at which coins were moved last.
Values >1 indicate that the market is in aggregate profit
Values <1 indicate that the market is at an aggregate loss
The dips below 1 show us that part of the market capitulated. Each of those underside rejections from 1 was traders selling as price hit their breakeven.
SOPR is now above 1 and climbing, suggesting that weak hands have been flushed, and the market is ready for upside.
Trade safe & have a great weekend
TCP
======
Pauper dear chap, a question if you would be so kind: when looking for confirmation via ichimoku, it seems to me that a lot of the bullish indicators also correlate with what the RSI might suggest as ‘overbought’. Thus I oft feel conflicted: ichimoku says ‘yes, buy now’ whereas RSI says ‘woah there nelly; this shit’s overbought’. Mayhaps it is better that I not conflate trading philosophies, and mayhaps I retire my use of the RSI. 🤷♂️
I missed deez reports so much!