
Under the hood of the TCP Swing Algo
They say you can't beat the performance of buy and hodl with technical analysis. Yeah, you can.

The Mission
What I set out to do here was create a trading algorithm that would:
Identify price swings
Avoid bull traps to maximum extent possible
Ride the trend and exit as close to the top as possible, without getting chopped up by entries and exits
Exit on corrective HTF swings (legs 2 & 4 for you Elliot Wave aficionados), and re-enters at a lower level
Beats buy and hold across as many scenarios as possible
This was obviously somewhat of a tall order, but as someone much smarter than myself once said:
We cannot solve our problems with the same thinking we used when we created them.
A new approach was needed, so I started from the basics. It’s common knowledge that I'm an Ichimoku trader, and that I have a great affinity to this strategy. My primary gripe with this system is that it’s somewhat slow in printing entries and exit signals, and is often open to interpretation.
Therefore I decided to develop my own interpretation of the cloud. This would have to be:
Simpler
Binary in nature - you’re either in or out (no discretionary entries such as an edge to edge with bearish TK lines)
The Approach
After a fair bit of deliberation, I settled on creating a Composite Performance Index (CPI) based off the general tenants of the legacy cloud. Two of these would be plotted on the chart with differing lookback periods (just like a moving average strategy). When the fast CPI closes above the slow one, an entry is signalled, and vice versa for an exit.
The exact formula behind the CPI is somewhat complex, and won’t be published. Consider it the recipe for my secret sauce.
Initial testing indicated that this approach provided great entries, however was beset by two performance sapping issues:
The strategy was susceptible to fakeouts and bull traps
If the periods were tight, I got perfect entries, however got chopped up quite badly as price printed its peaks and troughs on the way up. It outperformed buy and hold in downtrends and chop, but lost to it in uptrends. This was unacceptable, and needed to be addressed.
The first issue was a tough nut to crack, however after a non-trivial amount of time spent pondering at my favourite beach club, my (admittedly dim) lightbulb went off and I decided to experiment with filtering moves via buy/sell pressure plotted at price rather than time. This would inform the algo if the move was being faded or if it had legs.
The second issue was relatively simple and resolved by a directional volatility based trailing stop (i.e. it hugs price when it’s in Up Only mode and backs off when it’s chopping up and down). You can think of this as Supertrend 2.0.
Just as the International Space Station is held together with duct tape and cable ties, these two bandaids seemed to resolve my issues. It was time to run some backtesting.
Backtesting Results
To ensure against curve fitting, historical data was divided into optimisation and forward testing data samples. This allowed me to optimise on one part of the historical data, and forward test on the other part. I was also careful to stick to typical lookback periods (e.g. 50/100) and ignored any results from odd configurations (e.g. 47/102).
Once an optimal setup was identified, I ran some stress tests on the algo. The intention here was to compare its performance against various (albeit unlikely) scenarios, where one managed to buy/sell the absolute bottoms/tops at various points and held, vs the algo’s performance.
Here’s how it stacked up:
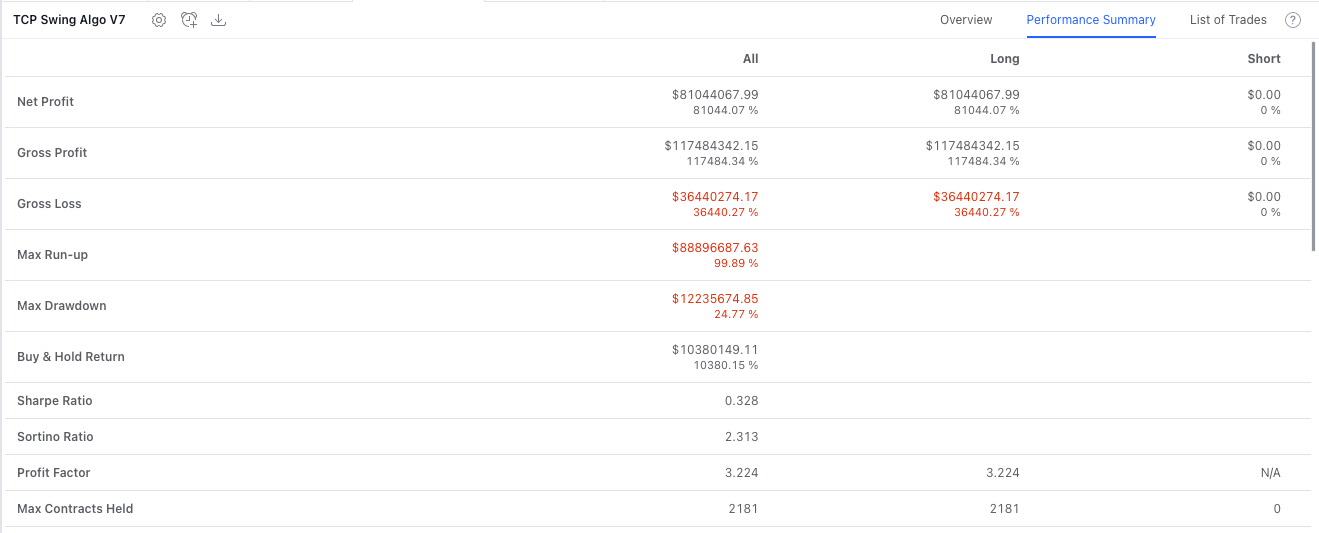
All the data: ($164 on 15/10/13 to $38,717 on 02/05/22) 81,000% vs 25,199% ✅
Long term hold: Previous ATH to date ($18,920 on 18/12/17 to $38,717 on 02/05/22): 1,236% vs 101% ✅
Bear market: 2017 ATH to Previous cycle low ($18,920 on 18/12/17 to $3120 on 15/12/18): 12% vs -82% ✅
Bull market: Previous cycle low to ATH ($3,120 on 18/12/18 to $68,991 on 10/11/21): 1,483% vs 1,812% ❌
Peak to peak: 1st Recent high to ATH ($64,900 on 10/04/21 to $68,991 on 10/11/21) 32% vs 2.18% ✅
Bear market: Recent ATH to date ($68,991 on 10/11/21 to $38,717 on 02/05/22) -7.1% vs -42% ✅
Recovery swing: Bottom of Elon crash to ATH ($28,816 on 20/07/21 to $68,991 on 10/11/21) 67% vs 115% ❌
Whilst the algo didn’t win in all scenarios, it did deliver convincing results overall, particularly when one bears in mind that it’s impossible to snipe absolute bottoms and tops in real life with no slippage and fees, (the algo simulation was run with 0.1% fees and 0.2% slippage, which are pretty much worst case scenarios).
Sauce:


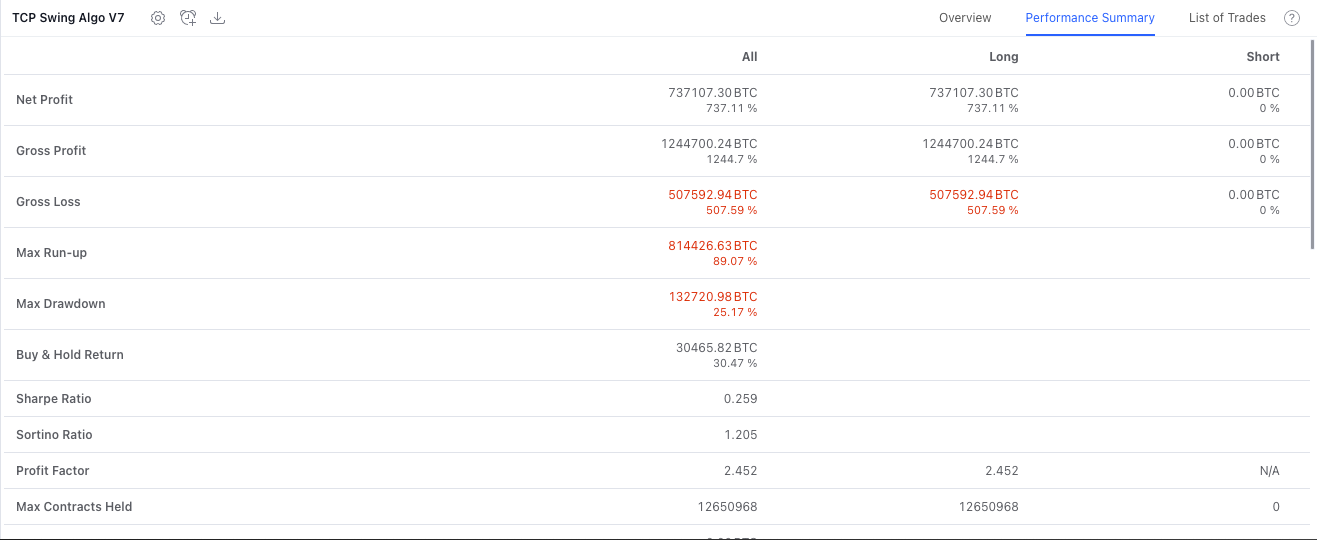
As you can see from the above, this strategy seems like it’ll work well running in a triangular fashion between BTC, ETH and USD (so USD<=>BTC<=>ETH<=>USD).
Next steps
Now that the hard part is done, I’ve hooked the strategy up to 3commas, and will be running it on a paper trading account to ensure that all orders are firing correctly and that there won’t be any surprises once it’s trading real monies.
Once that’s verified, my objective is to run a live test and publicly report its’ performance. I’m working on integrating TradingView with Twitter via Zapier, which should allow me to fire off tweets in realtime as trades are opened and closed. This will legitimise the strategy, and eliminate any claims that I’m larping, curve fitting etc.
The final step, should I see that the strategy really does deliver as tested, would be to set up a fund. Fortunately for me, most of my friends are finance lawyers, service providers, auditors etc. This simplifies the process dramatically vs someone trying to come in cold.
This would be in the format of a professional investment fund (PIF), so minimum investment would be €100K and would take approx 3-6 months to get to market. This would offer clients full regulatory protection and peace of mind, whilst allowing the fund to trade in high risk assets that are currently forbidden in a UCITS or retail fund.
Conclusion
It’s definitely possible to beat buy and hold. You simply need to approach the problem from a different angle and develop a new way of tackling it.
I’ve been tinkering on this for around a year, so, should you be encouraged to try developing your own algo, don’t anticipate great results on your first attempt. Expect to go down many false paths, where initially promising results turn out to be dead ends, forcing you back three steps. But be sure to learn from each of these missteps and eventually your hunches get better and results will come faster.
Trade safe.
TCP
Hey, if you want, I've set up a demonstrative python bot that integrates with trading view and Twitter.
Happy for you to use this.
Hi, when will this be available? thanks.